

RECENT ARTICLES

The Minard Map - "The best statistical graphic ever drawn"
“The best statistical graphic ever drawn“, is how statistician Edward Tufte described this chart in his authoritative work ‘The Visual Display of Quantitative Information’.The chart, or statistical graphic, is also a map. And a strange one at that. It depicts the advance into (1812) and retreat from (1813) Russia by Napoleon’s Grande Armée, which was decimated by a combination of the Russian winter, the Russian army and its scorched-earth tactics. To my knowledge, this is the origin of the term ‘scorched earth’ – the retreating Russians burnt anything that might feed or shelter the French,...…“The best statistical graphic ever drawn“, is how statistician Edward Tufte described this chart in his authoritative work ‘The Visual Display of Quantitative Information’.The chart, or statistical graphic, is also a map. And a strange one at that. It depicts the advance into (1812) and retreat from (1813) Russia by Napoleon’s Grande Armée, which was decimated by a combination of the Russian winter, the Russian army and its scorched-earth tactics. To my knowledge, this is the origin of the term ‘scorched earth’ – the retreating Russians burnt anything that might feed or shelter the French,...WW…
There Are at Least 10 Cities With Their Own Psychological Disorders
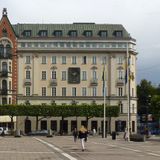
The hostage drama that took place in this building on Norrmalmstorg in 1973 gave rise to the term “Stockholm Syndrome.” The bank has long since been replaced by a high-end clothing store, but the vaults are still there. Holger.Ellgaard/Wikimedia/CC BY-SA 3.0hostages develop an attachment to their captors. But who knows its two opposites? Lima Syndrome is when the hostage takers start sympathizing with the hostages. And London Syndrome is when hostages become argumentative toward their captors—often with deadly results.In all, ten cities around the world carry a unique burden: they have a...…The hostage drama that took place in this building on Norrmalmstorg in 1973 gave rise to the term “Stockholm Syndrome.” The bank has long since been replaced by a high-end clothing store, but the vaults are still there. Holger.Ellgaard/Wikimedia/CC BY-SA 3.0hostages develop an attachment to their captors. But who knows its two opposites? Lima Syndrome is when the hostage takers start sympathizing with the hostages. And London Syndrome is when hostages become argumentative toward their captors—often with deadly results.In all, ten cities around the world carry a unique burden: they have a...WW…
- Total 2 items
- 1
