RECENT ARTICLES
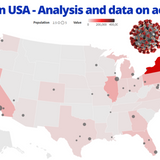
Covid-19 in USA - Data analysis with video, tables and bar charts - Statistics and Data
In this article, a new in-depth look at the Coronavirus in the United States of America. Thanks to video, data and processing we will see the development of active cases of Covid-19 in the United States from the beginning of the pandemic until today.Let’s start first of all from the 8th of October. According to the latest available data the total active cases of Coronavirus in the United States are 2,546,010. A trend of total cases that is undergoing a continuous ups and downs since August, but that all in all seems quite “stable”. The first state for active cases of Covid-19 is California...…In this article, a new in-depth look at the Coronavirus in the United States of America. Thanks to video, data and processing we will see the development of active cases of Covid-19 in the United States from the beginning of the pandemic until today.Let’s start first of all from the 8th of October. According to the latest available data the total active cases of Coronavirus in the United States are 2,546,010. A trend of total cases that is undergoing a continuous ups and downs since August, but that all in all seems quite “stable”. The first state for active cases of Covid-19 is California...WW…
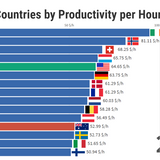
Top Countries by Productivity per Hour Worked - Statistics and Data
Which nations in the world have the most productivity, in terms of dollars, per hour worked? This question can be answered in this video made on the Statistics and Data channel. Let’s see together the Top 15 Countries by Productivity per Hour Worked – 1950/2017.The top country in the world for this metric in 2017 is Ireland. In fact, Ireland has a value of nearly $100 per hour worked. This is followed by Norway with more than $80 per hour and Switzerland with $69. In 1950 the top nation in the world for productivity per hour worked was the United States. The benchmark in this case was just...…Which nations in the world have the most productivity, in terms of dollars, per hour worked? This question can be answered in this video made on the Statistics and Data channel. Let’s see together the Top 15 Countries by Productivity per Hour Worked – 1950/2017.The top country in the world for this metric in 2017 is Ireland. In fact, Ireland has a value of nearly $100 per hour worked. This is followed by Norway with more than $80 per hour and Switzerland with $69. In 1950 the top nation in the world for productivity per hour worked was the United States. The benchmark in this case was just...WW…

10 Best Programming Languages to Learn in 2021 - Statistics and Data
The first programming language? It came about thanks to an English mathematician. In fact, Augusta Ada Byron, known as Ada Lovelace, defined the first programming language. It was an ‘assemblage’ language whose analytical machine, however, was never completed. The ‘Plankalk?l’ followed Ada Lovelace’s project. In 1942, Konrad Zuse, a German computer scientist and engineer, initiated this programming language developed for engineering applications. It was the first high-level programming language to be designed for a computer. The project saw its first versions from 1946 onwards.It is...…The first programming language? It came about thanks to an English mathematician. In fact, Augusta Ada Byron, known as Ada Lovelace, defined the first programming language. It was an ‘assemblage’ language whose analytical machine, however, was never completed. The ‘Plankalk?l’ followed Ada Lovelace’s project. In 1942, Konrad Zuse, a German computer scientist and engineer, initiated this programming language developed for engineering applications. It was the first high-level programming language to be designed for a computer. The project saw its first versions from 1946 onwards.It is...WW…

USA - Foreign-Born Population Percentage by State - Statistics and Data
In the last two centuries the United States has been one of the nations with the most immigrants. To understand this phenomenon it is enough to mention one fact: from 1835 to 1914, before the First World War, there were more than 30 million immigrants from Europe alone. In this new article we will deepen this topic. We will first see the 20 states in America with the highest percentage of population born abroad. Then we will deepen the topic with different macro data. Enjoy reading the article: USA – Foreign-Born Population Percentage by State.In 2018 the states with the most people born...…In the last two centuries the United States has been one of the nations with the most immigrants. To understand this phenomenon it is enough to mention one fact: from 1835 to 1914, before the First World War, there were more than 30 million immigrants from Europe alone. In this new article we will deepen this topic. We will first see the 20 states in America with the highest percentage of population born abroad. Then we will deepen the topic with different macro data. Enjoy reading the article: USA – Foreign-Born Population Percentage by State.In 2018 the states with the most people born...WW…
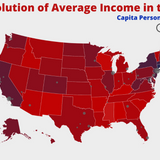
The Evolution of Average Personal Income in the United States -1929/2019 - Statistics and Data
In the United States, the average disposable income is $45,000 per year. A figure per capita (correct) which is significantly higher than the OECD average. Of the , the United States is almost 50% above the average (about 33 thousand dollars). But despite a good average figure, it is interesting to note that the richest 20% of the population makes up about 9 times more than the income of the poorest 20%. Just yesterday we had deepened . In this new article today we will try to deepen the evolution of the average income in the US. The data range from 1929 to 2019. The evolution of Average...…In the United States, the average disposable income is $45,000 per year. A figure per capita (correct) which is significantly higher than the OECD average. Of the , the United States is almost 50% above the average (about 33 thousand dollars). But despite a good average figure, it is interesting to note that the richest 20% of the population makes up about 9 times more than the income of the poorest 20%. Just yesterday we had deepened . In this new article today we will try to deepen the evolution of the average income in the US. The data range from 1929 to 2019. The evolution of Average...WW…
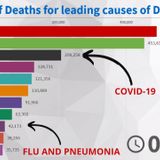
Evolution of Number of Deaths for leading causes of Death - U.S. (2020) - Statistics and Data
In this article/video a comparison between deaths for the main causes of death in the United States. The figure refers to the period from January 1 to November 8. For the data on Covid-19 the New York Times was used as a source. For data on other causes of death, 2018 data from the Center for Disease Control was used. Evolution of Number of Deaths for leading causes of Death – U.S.What are the main causes of death in the US? According to the latest data as of November 8, the deaths of Covid-19 are about 237,572. Covid-19 is the third leading cause of death in the US. A very high figure...…In this article/video a comparison between deaths for the main causes of death in the United States. The figure refers to the period from January 1 to November 8. For the data on Covid-19 the New York Times was used as a source. For data on other causes of death, 2018 data from the Center for Disease Control was used. Evolution of Number of Deaths for leading causes of Death – U.S.What are the main causes of death in the US? According to the latest data as of November 8, the deaths of Covid-19 are about 237,572. Covid-19 is the third leading cause of death in the US. A very high figure...WW…

Evolution of Economic inequalities in Europe - Statistics and Data
In this new article we will see some statistics on income poverty. The data refer to the European Continent, not only to the European Union. Deepening these elements is always important, but it is even more important now in the face of a new economic crisis. The data on poverty and income imbalance show that there is still a lot of work to be done.Let’s start with a first element. What is the gap between rich and poor in Europe? Which are the countries where this gap is greater? To do this I have taken Eurostat data as a reference. In this first video you can see the gap between rich and...…In this new article we will see some statistics on income poverty. The data refer to the European Continent, not only to the European Union. Deepening these elements is always important, but it is even more important now in the face of a new economic crisis. The data on poverty and income imbalance show that there is still a lot of work to be done.Let’s start with a first element. What is the gap between rich and poor in Europe? Which are the countries where this gap is greater? To do this I have taken Eurostat data as a reference. In this first video you can see the gap between rich and...WW…
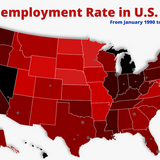
The Unemployment Rate in U.S. States from 1980 to September 2020 - Statistics and Data
, , What was the impact of the Coronavirus on the American economy? What is the trend of the employment rate in the different States of the U.S.? In this new analysis some tables, videos and graphs that show the trend of the labor market in the last 30 years.The darker the color of the individual states (red and then black) the higher the unemployment rate of the individual state. The two most difficult moments of the last 30 years in the United States of America are definitely 2. The financial crisis of 2008 and the Covid-19. In January 2010 for example the unemployment rate in California...…, , What was the impact of the Coronavirus on the American economy? What is the trend of the employment rate in the different States of the U.S.? In this new analysis some tables, videos and graphs that show the trend of the labor market in the last 30 years.The darker the color of the individual states (red and then black) the higher the unemployment rate of the individual state. The two most difficult moments of the last 30 years in the United States of America are definitely 2. The financial crisis of 2008 and the Covid-19. In January 2010 for example the unemployment rate in California...WW…
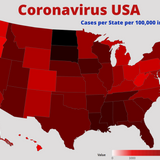
States in U.S. with more Covid Cases per 100,000 people - Statistics and Data
In recent weeks we have seen and read many graphs. Many of them talk about the absolute data of Covid-19. In this new in-depth study we will try to see the cases of Covid-19 for every 100 thousand inhabitants. A different way to see the data and understand where the Covid-19 cases are more based on the population. States in U.S. with more Covid Cases per 100000 people.The 3 states by total number of Covid-19 cases in the U.S. are Texas, California and Florida. Texas is the state with the highest total number of cases, 917,000 followed by California with 914,000. In third place is Florida...…In recent weeks we have seen and read many graphs. Many of them talk about the absolute data of Covid-19. In this new in-depth study we will try to see the cases of Covid-19 for every 100 thousand inhabitants. A different way to see the data and understand where the Covid-19 cases are more based on the population. States in U.S. with more Covid Cases per 100000 people.The 3 states by total number of Covid-19 cases in the U.S. are Texas, California and Florida. Texas is the state with the highest total number of cases, 917,000 followed by California with 914,000. In third place is Florida...WW…
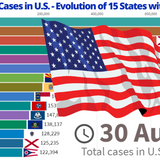
Covid-19 Cases in U.S. - Analysis with Bar Chart - Statistics and Data
In the United States the 6 million cases of Coronavirus have been overcome a few days ago. In this article/deepening we will see how the cases are distributed on a territorial level. Which are the 15 states where there are more cases? Are the total cases increasing? How many cases does the USA have compared to other countries? Covid-19 Cases in U.S.As of August 30, 2020 the first state in America by number of cases of Covid-19 is California. California, with a total population of over 38 million inhabitants, has 705,866 cases to date. In second place is Texas with 638,947 cases. Texas is...…In the United States the 6 million cases of Coronavirus have been overcome a few days ago. In this article/deepening we will see how the cases are distributed on a territorial level. Which are the 15 states where there are more cases? Are the total cases increasing? How many cases does the USA have compared to other countries? Covid-19 Cases in U.S.As of August 30, 2020 the first state in America by number of cases of Covid-19 is California. California, with a total population of over 38 million inhabitants, has 705,866 cases to date. In second place is Texas with 638,947 cases. Texas is...WW…