
July 1, 20205 min read, 966 words

Published: July 1, 2020 | 5 min read, 966 words
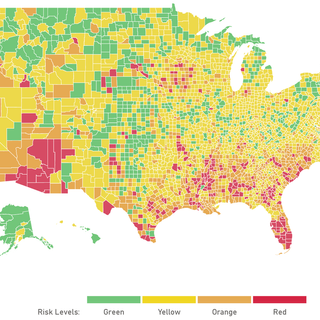
Where Are Coronavirus Cases Getting Worse? Explore Risk Levels County By County : Shots - Health News A new color-coded map, backed by a coalition of top scientists, provides a way of comparing outbreak severity across communities, down to the county level.Heard onToggle more opt...
No article scores yet.
There are no critic or public scores for this article yet.


critic score
18 reviews
public score
78 reviews

critic score
0 reviews
public score
3 reviews
critic score
0 reviews
public score
0 reviews
CRITIC REVIEWS
There don't seem to be any reviews yet.
PUBLIC REVIEWS
There don't seem to be any reviews yet.