

Scores for this article.
Percentage of critic and public trust in this article.
Well Sourced2

critic score

public score
critic score
11 reviews
public score
64 reviews
critic score
1 reviews
public score
5 reviews
critic score
0 reviews
public score
4 reviews
CRITIC REVIEWS
There don't seem to be any reviews yet.
PUBLIC REVIEWS
Balanced
March 27, 2020
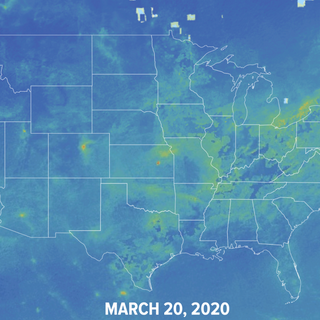
The best thing about this one is the maps. There's no much content or in-depth analysis to check out - I'd like to read something that I can't read in the images - but it brings excellent information.
March 27, 2020
Well Sourced
March 26, 2020
A very good and well-sourced article highlighting the sudden drop in U.S. nitrogen dioxide emissions and how climate scientists might be able to learn more from this unprecedented shutdown. I wish more figures were provided but I understand that those numbers are still being calculated by the climate scientists studying the situation.
March 26, 2020
Well Sourced
March 26, 2020
You can't argue with data! :)
March 26, 2020
Political Agenda
April 7, 2020
This is taking a pandemic and using it to push a political agenda that drives the climate change narrative.
April 7, 2020